
Tom and Kristin Scott are 40 and 35. ?Their two daughters, Daisy and Jody, are 10 and 8. ?Tom is a sales manager, Kristin is a pharmacist, and between them, their gross earnings are $195,000.
Assume you have discussed various aspects of their financial goals with them and have established two priorities:
- Making sure the girls are OK financially if either or both of the parents die;
- Retirement planning.
This Blog will discuss what they should do to ensure the security of their girls -- including reserves for college costs. Next week, we’ll look at their retirement plans.
College Cost Analysis - Step 1
Tom and Kristin want to provide at least $30,000 a year for six years for each child (the extra two years are for some form of graduate school).
Table 1
| Year | College Funds for Daisy, 10 | College Funds for Jody, 8 | Total |
| 8 | 30,000 | 30,000 | |
| 9 | 30,000 | 30,000 | |
| 10 | 30,000 | 30,000 | 60,000 |
| 11 | 30,000 | 30,000 | 60,000 |
| 12 | 30,000 | 30,000 | 60,000 |
| 13 | 30,000 | 30,000 | 60,000 |
| 14 | 30,000 | 30,000 | |
| 15 | 30,000 | 30,000 | |
| Total: | 180,000 | 180,000 | 360,000 |
With a 5.00% pre-tax yield assumption, the Educational Needs Analysis module in the InsMark Illustration System indicates a requirement for $257,286 of life insurance to cover the costs in
Table 1. ?Click here for the report.
What about inflation on college costs? ?College inflation has eased somewhat from the 6% - 7% of recent years, but let’s include at least a 4.00% inflation factor.
Table 2
| Year | College Funds for Daisy, 10 | College Funds for Jody, 8 | 4.00% Inflation Adjustment | Total |
| 8 | 30,000 | 11,057 | 41,057 | |
| 9 | 30,000 | 12,699 | 42,699 | |
| 10 | 30,000 | 30,000 | 28,815 | 88,815 |
| 11 | 30,000 | 30,000 | 32,367 | 92,367 |
| 12 | 30,000 | 30,000 | 36,062 | 96,062 |
| 13 | 30,000 | 30,000 | 39,904 | 99,904 |
| 14 | 30,000 | 21,950 | 51,950 | |
| 15 | 30,000 | 24,028 | 54,028 | |
| Total: | 180,000 | 180,000 | 206,882 | 566,882 |
Again with a 5.00% pre-tax yield assumption, the Educational Needs Analysis module indicates a requirement for $404,003 of life insurance to cover the cost of Table 2. ?Click here for this report.
Who should be insured and for how much? ?Since something can happen to either Tom or Kristin, I believe it is suitable to insure them both for $400,000 so the funds are available for college either way. The annual costs for 15-year level term are: Tom: $300; Kristin: $200.
That’s an easy, cost-efficient solution.
Comprehensive Analysis - Step 2
I broke this evaluation into two steps because I want you to think about the reaction a couple like Tom and Kristin will have when you are able to provide a solution for one of their serious concerns: guaranteed college for the girls for $500 a year in term insurance premiums. ?The compensation on the term insurance should be irrelevant to you. ?Don’t you think they will want to hear what you have to recommend next? ?You bet they will!
But we’re not finished yet. ?What about the other financial needs for Daisy and Jody until they are both out of college? ?Tom and Kristin are interested in an overall survivor plan that includes the following after tax cash flow, some of which will require a trust:
- $25,000 for final expenses.
- $25,000 for an emergency fund;
- $190,000 to pay off the mortgage;
- $25,000 to upgrade their home (Kristin’s sister, Jennifer and her husband, Joe, have agreed to act as guardians for Daisy and Jody. They have three children and will likely move into the Scott’s home);
- $30,000 a year for the next 15 years plus a 3% factor for inflation;
- College funds noted in Table 2 above;
- $50,000 to Daisy at age 25 for personal use: down payment on a home, investment in a business, travel, etc.;
- $50,000 to Jody at age 25 for personal use: down payment on a home, investment in a business, travel, etc.
Note: The last two items extend the analysis to 18 years.
At this point, we need to shift to the Survivor Needs Analysis (“SNA”) module in the InsMark Illustration System in order to take into account the various categories noted above.
Based on the above data, SNA indicates the following in red at the bottom of the Summary report:
Conclusion and Recommendation
We have compared the year-by-year relationship between your financial goals and expected assets benefits.
Based on your assumptions, your expected assets/benefits are not sufficient to meet all your financial goals. For you to eliminate this shortfall, you should secure additional life insurance in the amount of $497,009.
Below is the graphic of that analysis:
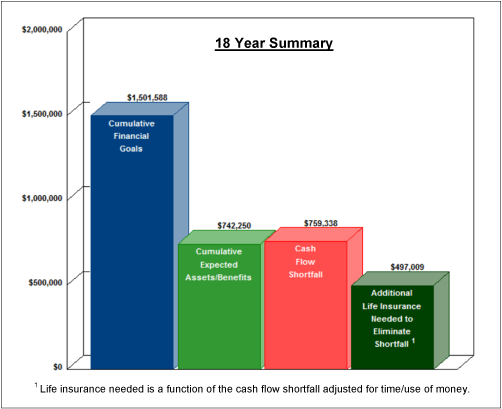
Click here for the full report indicating the shortfall.
Since something can happen to either Tom and Kristin, I believe it is suitable to insure them each for $500,000. ?The 15-year level term costs are: ?Tom’s annual premium: $600; Kristin’s annual premium: $400.
If you went back through SNA and entered the exact amount of the additional life insurance on the current assets/benefits tab, you would see this highlighted in green at the bottom of the Summary report.
Conclusion and Recommendation
We have compared the year-by-year relationship between your financial goals and expected assets benefits.
Based on your assumptions, this plan is in perfect balance. No additional life insurance is required at this time.
Below is the graphic of that analysis:

Click here for the full report indicating the perfect balance.
I think leaving a client with a complete report this way makes sense. ?Almost no one does this, but it is far better than having the reports showing the shortfall as the last documentation provided to the client. ?This approach goes particularly well when you are delivering the life insurance policies.
Don’t tune me out because of term insurance. ?Next week, Blog #47 will address Tom and Kristin’s retirement planning concerns, and we’ll include the term insurance solutions contained in this Blog.?We’ll also look at a cash value alternative to the term insurance. ?You’ll learn about a long-range mistake of $3.6 million that Tom and Kristin will likely want to avoid if the cash value alternative is ignored.
Conclusion
This has been an effective analysis, and I don’t think you will find calculators that can handle data like this anywhere other than in the InsMark Illustration System. ?I spent several hours this week scouring the web for calculators that claim to tell you how much life insurance you need. ?None of them could handle anything like Tom and Kristin’s analysis. ?This type of evaluation is fast becoming a dying art in the life insurance business, and I am very proud we are keeping it front and center in our software.
Speaking of “proud”, MONEY magazine ran a contest a few years back entitled “The MONEY Life Insurance Test”. ?Producers from MassMutual, Northwestern Mutual, and several other top companies participated. ?Our Survivor Needs Analysis provided the analytical tools used by State Farm Agent, Thomas Davis, for his first place finish in the contest. Click here to read that report from MONEY magazine.
At one time or another, almost all your clients ask themselves this question: How Much Life Insurance Do We Really Need? There are very few producers who can respond with a responsible answer to this question, let alone provide an evaluation like the one for Tom and Kristin. ?Those of you with the InsMark Illustration System can certainly do it. ?(The Educational Needs Analysis and the Survivor Needs Analysis modules are located on the Personal Needs Analysis tab.)
Note: Business owners also need to know “how much” life insurance to carry on key executives. ?That’s why we also have the Key Executive Life Insurance Calculator located in the InsMark Illustration System. ?If this interests you, check out Blog #44.
Case Data File
If you are licensed -- or become licensed -- for the InsMark Illustration System and would like to review the data input we used for the survivor analysis, please email us at bob@insmarkblog.com, and we will get the Case Data file (Workbook) right out to you. Be sure to ask for the Workbook associated with Blog #46: Let’s Make Sure the Girls Go to College.
Note: ?The data entry for Educational Needs Analysis is simple. ?The Survivor Needs Analysis module is a little more complex, and a Data Input Form is available on the drop-down Tools selection on the main menu bar of the InsMark Illustration System. At first glance the data input may look intimidating, but on most pages, you will be entering data in only a few of the listed categories. To acquaint yourself with it, try filling one out for your own situation -- you may be pleasantly surprised. It is a form you will want to fill out with your clients input. ?Consider giving your clients and prospects a link to this Blog as a good way to introduce this planning concept to them.
Licensing
To license the InsMark Illustration System, contact Julie Nayeri at julien@insmark.com or 888-InsMark (467-6275). Institutional inquiries should be directed to David Grant, Senior Vice President - Sales, at dag@insmark.com or 925-543-0513.
Testimonial:
“InsMark is the Picasso of the financial services world — their marketing savvy never fails to amaze me.”
Doug Peete, Past President, Top of the Table, and InsMark Power Producer,
Overland Park, KS