
|
Editor's Note: The purpose of this Blog is to compare retirement cash flow planning with and without the use of life insurance. Bob then introduces a third strategy (including the life insurance) that increases spendable, retirement cash flow by as much as 30% to 40%. Your clients will love it. |
Private Retirement Plan (also referred to as “PRP”): A cash-rich life insurance policy is used to accumulate funds prior to retirement from which loans and/or withdrawals are taken during retirement years. “Private” in this sense is used to make the distinction between this plan and a tax qualified plan such as an IRA, or 401(k), or profit sharing plan. There are no restrictions on the amount of funds paid into a Private Retirement Plan, and no approval or permission from the IRS is required for any aspect of it.
The following three features of the life insurance used in such plans are what make the results so unique:
- Cash values accrue without income tax;
- Cash values can be accessed without income tax using withdrawals to basis and/or loans;
- Death benefits are paid to beneficiaries without income tax. (This applies to the full death benefit, including any cash value component whether loans exist or not.)
Case Study
The purpose of this Blog is to compare retirement planning for Tony and Jennifer Callahan with and without use of a Private Retirement Plan and then introduce a third innovation that increases spendable, retirement cash flow by as much as 30% to 40%.
Tony and Jennifer are ages 45 and 40. He is a physician, and she is a CPA. Between them, their gross income is $550,000. After tax, their net income is $300,000.
The Callahans’ present plan is to duplicate their current after tax income of $300,000 beginning at retirement ages 65/60 and index it by 3.00% a year for an inflation offset. This will be reevaluated yearly and adjusted accordingly as their after tax income increases (or even if it decreases).
Their current net worth is a little over $2,000,000. Below are the details:
| $ 500,000 | Equity Assets ¹ @ 6.50% growth; 1.00% dividend |
| 500,000 | Taxable Assets @ 4.00% |
| 250,000 | Tax Exempt Assets @ 3.00% |
| 180,000 | Retirement Plan ² Assets @ 7.50% |
| 500,000 | Residence @ 6.00% growth |
| (400,000) | Mortgage @ 4.75% |
| 100,000 | Art Collection @ 7.50% |
| 400,000 | Personal Property @ -5.00% |
| $2,030,000 | Total Net Worth |
|
¹ |
Continuing annual pre-retirement contributions assumed to be $35,000 a year. |
|
² |
Continuing annual pre-retirement contributions assumed to be $17,500 a year increasing by 3.00%. |
Click here for comments regarding yields and Monte Carlo simulations.
Strategy 1
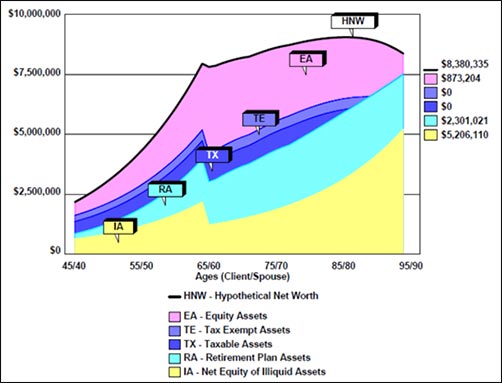
Based on the above assumptions, below is an InsMark Wealthy and Wise® graphic of Strategy 1, Tony and Jennifer’s illustrated net worth over the next 50 years. It includes the withdrawal of spendable, retirement cash flow of $300,000 a year starting at their ages 65/60 and increasing by 3.00% a year thereafter. The Callahans have a very promising future.
Strategy 1 - Net Worth
Let’s see if we can improve it.
Strategy 2
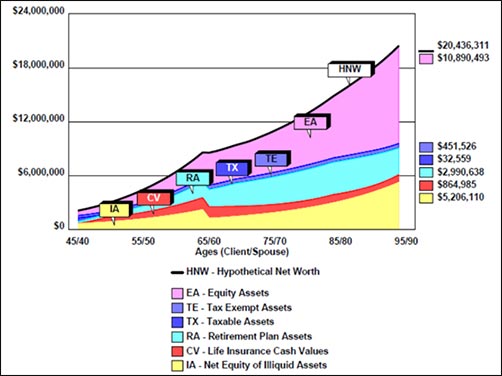
We’ll integrate a Private Retirement Plan into their analysis by adding an Indexed Universal Life (IUL) policy with $2,500,000 of level death benefit with five scheduled $100,000 premiums. We’ll call this Strategy 2.
Click here to review the IUL illustration used with Strategy 2.
Normally, if you present the Callahans with an illustration like this, their reaction would likely be "Are you crazy? A $100,000 premium is a third of our current after tax income." But here comes the magic of Wealthy and Wise because we can direct the program to integrate the policy into their overall asset base.
- The premiums will be paid by withdrawals from their current net worth;
- The policy values will add to their net worth;
- The policy loans will provide a large portion of their annual $300,000+ spendable retirement cash flow.
Below is the revision to Tony and Jennifer’s illustrated net worth over the next 50 years including the impact of the IUL.
Strategy 2 - Net Worth
Below is a comparison of the two variations.
Strategy 1 vs. Strategy 2
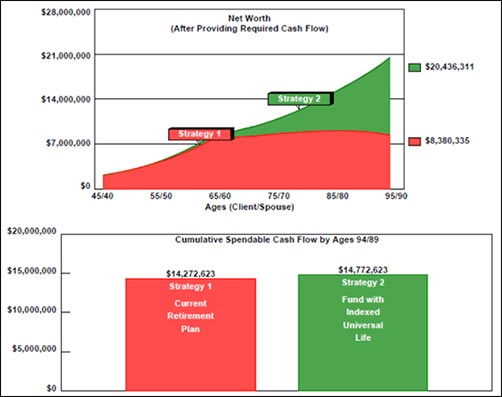
Strategy 2 shows a long-range increase in net worth in excess of $12,000,000 (an increase of 143%). Be sure you understand that the only difference between Strategy 1 and Strategy 2 is the inclusion of IUL in Strategy 2. In all other respects, they both use the same data.
In the lower half of the graphic, you can see that both strategies produce $14,000,000+ in spendable retirement cash flow. $9,000,000 of that is $300,000 a year times 30 years (ages 65/60 through ages 95/90). The balance is the result of the 3.00% indexing. The gain in Strategy 2 is caused in large part by the substantial policy loans from the IUL which significantly reduces the amount of cash flow needed from other assets.
The lower half of the graphic shows Strategy 2 with $500,000 more cumulative spendable cash flow than Strategy 1 as the system is accounting for the five $100,000 IUL premiums added to desired cash flow. Remember -- this technique involves an asset transfer for the IUL premiums so we have to account for the funds needed for those five premiums.
I rarely use words like “astonishing” in my Blog, but I will this time -- Strategy 2 has produced an astonishing result.
Click here to review the year-by-year numbers for cash flow, net worth, and wealth to heirs for Strategies 1 and 2.
Strategy 3a
Many producers who use Wealthy and Wise find this type of analysis provides such an increase in net worth that it will allow a substantial gifting program for heirs. And while it does accomplish this, I am going to take a different tack with Strategy 3a and see if I can increase the Callahans’ spendable, retirement cash flow instead.
The additional net worth developed in Strategy 2 allows us to increase Tony and Jennifer’s spendable, retirement cash flow by another $100,000 a year, also increasing by 3.00%, and those results are shown below.
Strategy 1 vs. Strategy 3a

Strategy 3a generates an increase of almost $5,300,000 in spendable, retirement cash flow, a 37% increase, while maintaining virtually an identical amount of net worth as Strategy 1, the Callahans’ current plan.
For those of you specializing in retirement cash flow from cash value life insurance, this unique use of our Wealthy and Wise system can put you head and shoulders above your competition.
Click here to review a report showing the year-by-year cash flow, net worth, and wealth numbers of Strategies 1, 2, and 3a.
Strategy 3b
Dealing with Termites
 Somewhere, someone like Suze Orman will surely say, “Yeah, but you could do even better if the Callahans bought term insurance and invested the difference.” As the saying goes, “some people know the price of everything and the value of nothing.” Let’s dispel that term insurance myth right now as it relates to 21st century cash value life insurance. Below is a Wealthy and Wise graphic where we created Strategy 3b by including $2,500,000 of 20-year level term on Tony instead of the $2,500,000 IUL. The term policy has a level $2,800 annual premium.
Strategy 3a vs. Strategy 3b
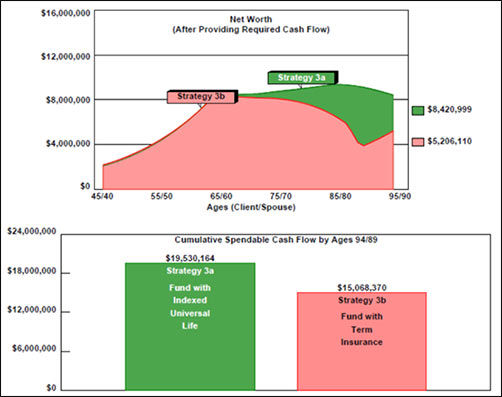
It’s not even close. Strategy 3b results in a 38% reduction in net worth and a 23% reduction in spendable, retirement cash flow compared to Strategy 3a. The upslope in net worth in the last few years of Strategy 3b is when all liquid assets are exhausted and only illiquid assets remain (Tony and Jennifer’s home, for example). No liquid assets means no cash flow, thus the overall reduction in long-range net worth and cumulative spendable cash flow. (Wealthy and Wise can liquidate selected illiquid assets when this occurs, but selling their home is not appropriate for this evaluation -- it’s best not to buy the term insurance.)
Click here to review the year-by-year numbers for cash flow, net worth, wealth to heirs for Strategies 3a and 3b.
Click here to review all the Wealthy and Wise reports associated with Strategies 1, 2, 3a, and 3b. This is divided into two sections: The Comparison section (18 pages) and the Appendix with all the backup reports (164 additional pages). That is a huge number of reports, I know; however, I have been asking Wealthy and Wise licensees for years which reports they include in order to trim down the number for specific presentations. I have never gotten the same selections twice, so I leave it to you to decide. In this case, I included every possibly one. (The Comparison section is key, but you will need many of the back-up reports.) I recommend that you have all the reports somewhere in your possession particularly if you are visiting with a client’s attorney or CPA. Wealthy and Wise backs up every number shown, and you need access to all reports for the inevitable question from a client, attorney, or CPA, “Where did this number come from?”
Note: Our licensees often ask me how best to illustrate comparisons to term insurance in Wealthy and Wise. Strategy 3a vs. Strategy 3b shows how to do it.
Final Thought #1:
I know that many of my readers are comfortable selling the retirement cash flow features of IUL using a stand-alone illustration that is not integrated with a client’s other assets. Clients typically consider the premiums to be an expense for such plans. Changing to a Wealthy and Wise analysis creates a new learning curve because your presentation changes to an asset transfer. Believe this: the wealthier a client, the easier it is to convince him or her of the power of integrating IUL into their portfolio of assets with this type of analysis. With allocations from current assets as the source of the IUL premiums as shown in this Blog, it becomes a case of “comparing assets and cash flow if you do it -- with what happens if you don’t”. And that is a completely different presentation, and it can have compelling results for you. With some clients, Strategy 2 (greater net worth) will be sufficient; others will be very impressed (perhaps even astonished) with your Strategy 3a logic (greater cash flow) -- or, perhaps, somewhere in between.
The payoff? You will develop much higher average compensation per case, and a client locked into your planning expertise, not just an IUL policyholder. Tended to carefully, you will likely have this client for life.
If you are an experienced user with Wealthy and Wise, putting a case together like this will be relatively straightforward. (See below to obtain the electronic Workbook I used to prepare the data for all the Strategies evaluated in this Blog.)
That’s the good news. The bad news for some is that you have to gather all of your client’s financial data for this type of analysis. Many of my readers are used to doing this. For those of you who are not so comfortable with it, how do feel about asking a prospective client to reveal details of financial data? Clearly, you have to earn a prospective client’s trust to do that. My suggestion for the best way to gain that confidence is to share examples of how this concept works for others -- this Blog, for example, or the Wealthy and Wise reports associated with it.
Note: A Fact Finder is available in Wealthy and Wise to guide you in your data gathering (see Tools on the main menu bar). Many of our licensees tell me they think the Fact Finder is best filled out with the client(s) present and involved in the process.
At first glance the Fact Finder may look intimidating, but on most pages, you will be entering data in only a few of the listed categories. To acquaint yourself with it, try filling one out for your own situation. Then enter your data in your System -- you may be pleasantly surprised.
Final Thought #2:
The following paragraph appeared earlier in this Blog, and I want to draw your attention to a different aspect of it -- particularly the last sentence:
The Callahans’ current plan is to duplicate their current after tax income of $300,000 beginning at retirement ages 65/60 and index it by 3.00% a year for an inflation offset. This will be reevaluated yearly during pre-retirement and adjusted accordingly as their income increases.
As their income increases, Tony and Jennifer will certainly want to adjust the projected amount of spendable, retirement cash flow at retirement, and here is the point: They will need you to bring their plan up-to-date every year, and this means you not only have opportunities for additional planning strategies, you also have the opportunity to charge an annual fee for each review. This is easier to negotiate if you charge a fee for the initial study. Look what you can accomplish for clients like the Callahans who are likely to be stunned by the results of the analysis. Isn’t this worth a good-sized fee, at least in future years?
Click here for a few questions and answers about this case that may be useful to you.
Important Note: Many of you are rightly concerned about the potential tax bomb in life insurance that can accidentally be triggered by a careless policyowner. Click here to read Blog #51: Avoiding the Tax Bomb in Life Insurance.
InsMark’s Digital Workbook Files
If you would like some help creating customized versions of the presentations in this Blog for your clients, watch the video below on how to download and use InsMark’s Digital Workbook Files.
Digital Workbook Files For This Blog
Download all workbook files for all blogs
|
Note: If you are viewing this on a cell phone or tablet, the downloaded Workbook file won’t launch in your InsMark System. Please forward the Workbook where you can launch it on your PC where your InsMark System(s) are installed. |
If you obtain the digital workbook for Blog #58, click here for a guide to its content.
Licensing
To license Wealthy and Wise and/or the InsMark Illustration System, contact Julie Nayeri at julien@insmark.com or 888-InsMark (467-6275). Institutional inquiries should be directed to David Grant, Senior Vice President ? Sales, at dag@insmark.com or 925-543-0513.
Testimonials:
"I am writing to give you a ringing endorsement for the Wealthy and Wise System. As you know, I am a LEAP practitioner, and the Wealthy and Wise software has helped me supplement my LEAP skills and increase my commissions. I have been paid for many cases using Wealthy and Wise as support, the smallest of which was $27,000, the largest was $363,000. With those type of commissions, you would have to be nuts not to buy it."
Vincent M. D'Addona, CLU, ChFC, MSFS, AEP, InsMark Power Producer
"As I’ve said to anyone that will listen, Wealthy and Wise is the best piece of software in the industry.”
Simon Singer, International Forum Member, InsMark Power Producer, Encino, CA
"If you don’t get the client to distinguish cash flow from net worth, you won't make the case sale. In my experience, Wealthy and Wise is the only system that recognizes this important estate planning component.”
Stephen Rothschild, CLU, ChFC, CRC, RFC, International Forum Member, Saint Louis, MO