(Click here for Blog Archive)
(Click here for Blog Index)
(Presentations in this blog were created using the InsMark Illustration System)

In Blog #146, we examined a “Compared to What?” illustration for Tom Robinson, age 35, involving $601,839 of Indexed Universal Life (IUL) at 7.00% with scheduled premiums of $20,000 a year through age 65.
The comparison involved $600,000 of level 30-year term with a premium of $525 coupled with a tax deferred account (think indexed annuity) at the same 7.00% as the IUL. Premiums for the indexed annuity were $19,475 which, when added to the $525 for the term, totaled the same $20,000 as the premiums for the IUL. Tom is in a 35% federal and state, marginal, income tax bracket.
At retirement age 65 (as the 30-year term insurance expires), Tom is scheduled to make a participating loan of $1,483,951 on the IUL which, when matched with a withdrawal from the indexed annuity, causes the complete termination of the annuity. The IUL is left with sufficient cash value to generate $2,900,000 in further retirement cash flow plus remaining cash value of $1,336,676 at the end of the analysis. The IUL is the clear “winner” – it’s not even close.
When “buy term and invest the difference” is examined mathematically rather than conversationally, it typically is revealed as a delusion. To quote G.K. Chesterton who some believe to be the greatest thinker and writer of the 20th century, “Fallacies do not cease to be fallacies because they become fashions.”
Case Study (Equity Account)
Let’s examine what would happen if we used an equity account instead of an indexed annuity as the alternative. The goal is to produce the identical amount of free cash from the IUL at age 65 that would exist if the equity account is surrendered. The amount of free cash from either financial instrument is identical – with continuing cash value remaining in the IUL.
The equity account assumptions are:
|
7.00% Growth |
|
1The indexes available for IUL generally don’t credit a dividend. The current S&P 500 dividend yield is about 2.00%. So to be fair, I included a 2.00% dividend for a gross yield of 9.00%, 200 basis points greater than the IUL interest rate assumption of 7.00%.
2index fund assumed.
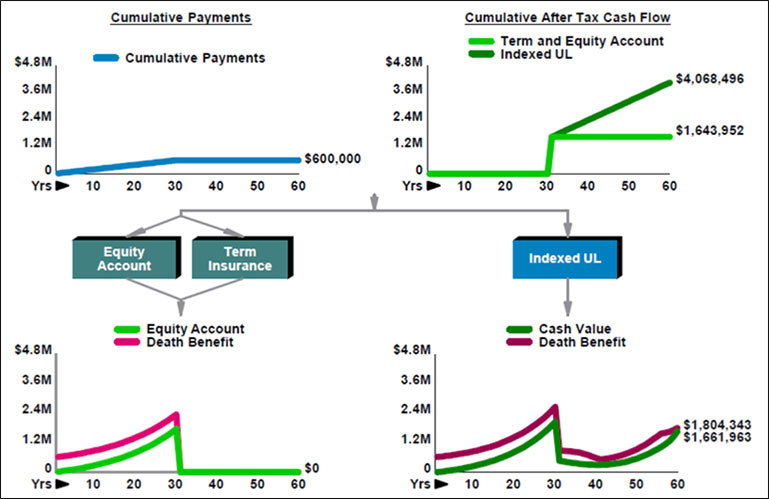
As with the indexed annuity, annual deposits to the equity account are $19,475 which, when added to the $525 for the term insurance, total the same $20,000 as the premium for the IUL. I scheduled a participating loan of $1,643,952 on the IUL to match the value of the equity account if cashed out.
The IUL is left with sufficient cash value to generate $83,605 in participating loans for 29 years which by Tom’s age 95 would total $2,424,545 in after tax retirement cash flow plus remaining cash value of $1,661,963 at the end of the analysis. Again, the IUL is the clear “winner” by a huge margin.
Cash Flow Summary
- The equity account produces $1,643,952 in after tax funds at age 65.
- The IUL produces the same $1,643,952 in after tax funds at age 65 plus $2,424,545 in subsequent cash flow plus residual cash values of $1,661,963 at age 95.
Below is a graphic of the comparison:
Term Insurance and an Equity Account
vs.
Indexed Universal Life
Image 1

Click here to review this comparative illustration from the InsMark Illustration System produced by the Permanent vs. Term module on the Personal Insurance tab.
The key illustration numbers are on Pages 2 and 3 of 12. Equally important are the four pages that follow which detail the equity account’s values. Bear down on these four pages to be sure you follow the tax implications of the equity account.
As you can see on Page 8 of 12, the equity account would need a growth rate of 10.05% – plus the 2.00% dividend – for a total yield of 12.05% to match the results of the IUL (505 basis points more as than the IUL at 7.00%).
The graphics starting on Page 9 of 12 are particularly informative.
An Alternative
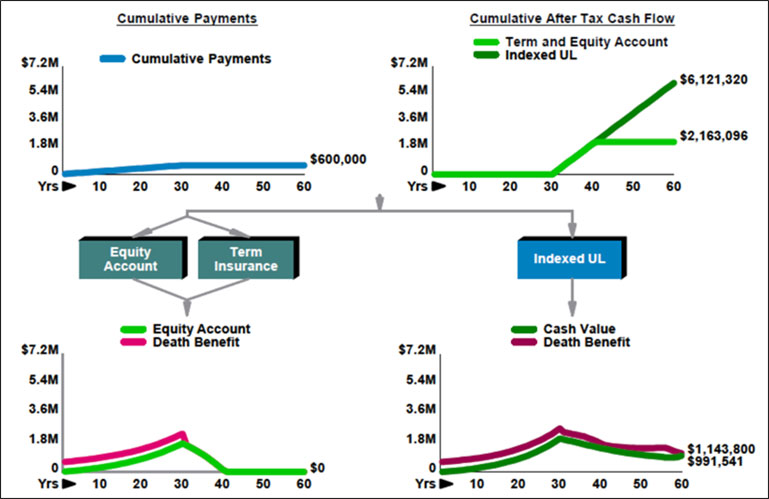
If Tom were to retain the $1,643,952 in the IUL at age 65 rather than distribute it by loan to match the cash out value of the equity account, his annual after tax retirement cash flow could increase to $204,044 through his age 95 (and continue thereafter should he live longer), a rather amazing result. This would, of course, mean the equity account would survive at age 65 to match the after tax cash flow of $204,044 from the IUL, but it could do so for only 10 years, followed by $122,656 for one year, at which point it would be depleted.
Cash Flow Summary
- The equity account produces $2,163,096 in after tax cash flow from age 65 to 75.
- The IUL produces the same $6,121,320 in after tax cash flow from age 65 to 95 plus residual cash values of $991,541 at age 95.
Below is a graphic of this comparison:
Term Insurance and an Equity Account
vs.
Indexed Universal Life
Image 2

Click here to review this comparative illustration from the InsMark Illustration System produced by the Permanent vs. Term module on the Personal Insurance tab.
Note: Many financial experts believe that income tax rates will have to at least double to deal with the consequences of out-of-control entitlements and the lurking menace of major increases in interest rates on federal debt. Although the election of Donald Trump likely delays this from happening in the short term, it appears to be ultimately inevitable. Tom’s IUL would be unaffected by increases in federal taxes while the equity account would be further diminished.
A Final Thought from Dave Ramsey and Suze Orman
There is one remaining criticism from these two that bears review: “The surrender charges are horrendous with IUL.”
While not particularly critical to a serious buyer since it is the accumulation value that gets the credited index rate, this objection should scare off the non-serious buyer. On the other hand, there is an alternative. Most issuers of IUL have an option that waives most of the early surrender charges.
For example, in the illustration just above, if I select that option, the resulting first year cash value increases from $4,897 to $17,360 (86.80% of the $20,000 premium) – but by year 30, it slips from $2,047,278 to $1,933,422, a drop of $113,850. As a result the policy can support only $198,632 of continuing after tax cash flow instead of $204,044. So there is a small, long-range price to pay of $162,360 in reduced after tax cash flow by selecting the high early cash value option. To some it may be worthwhile; to others, an unnecessary reduction.
Click here to review the results of this high early cash value option. As you can see on Page 8 of 12, the equity account would need a growth rate of 9.52% – plus the 2.00% dividend – for a total yield of 11.52% to match the results of the IUL (452 basis points more than the IUL at 7.00%).
Conclusion
The next time you run into a prospect or an adviser that raises the “invest the difference” argument, ask this question: “If something you believe to be true turns out to be wrong, when would you want to know about it?”
This almost always generates this response, “What do you mean?”
Respond with, “I need fifteen minutes to show you. When can we do that?”
Sales suggestion: Always bring a comparison to term and invest the difference with you to any interview – even if you think you won’t need it. You may not need it, but is it ever valuable if you do. You never know when this issue will surface. Imagine an interview where your prospect (or his attorney or CPA who happens to be present) brings this up just as you are ready to close the sale. The comparative analysis requires a demonstration of the math involved, and it is difficult to do it without the proof of the numbers. So have several of them with you.
Click here for some information about preparing this illustration that will be helpful if you want to duplicate it. (Downloading the digital workbook file for Blog #147 below will also be useful as you can see the precise keystrokes I used in the InsMark Illustration System to prepare the illustration.)
More on the Subject
In Blog #148: New Logic for Permanent vs. Term (Part 3), I’ll examine permanent vs. term in the context of a comprehensive Wealthy and Wise® evaluation comparing retirement cash flow, net worth, and wealth to heirs.
InsMark’s Digital Workbook Files
If you would like some help creating customized versions of the presentations in this Blog for your clients, watch the video below on how to download and use InsMark’s Digital Workbook Files.
New Zip File Downloaders
Watch the video.
Experienced Zip File Downloaders Download the zip file, open it, and double click the Workbook file name to open it in your InsMark System.
If you obtain the digital workbook for Blog #147, click here for a Guide to each of the illustrations.
|
Note: If you are viewing this on a cell phone or tablet, the downloaded Workbook file won’t launch in your InsMark System. Please forward the Workbook where you can launch it on your PC where your InsMark System(s) are installed. |
Licensing InsMark Systems
To license any of the InsMark software products, visit our Product Center online or contact Julie Nayeri at Julien@insmark.com or 888-InsMark (467-6275). Institutional inquiries should be directed to David Grant, Senior Vice President – Sales, at dag@insmark.com or (925) 543-0513.
For help on how to use InsMark software, go to The Quickest Way To Learn InsMark.
Testimonials
“The InsMark software is indispensable to my entire planning process because it enables me to show my clients that inaction has a price tag. I can’t afford to go without it!”
David McKnight, Author of The Power of Zero, InsMark Gold Power Producer®, Grafton, WI
“The reason I use InsMark products is because they are so good at explaining financial concepts to all three parties: 1) the producer trying to explain the idea; 2) the computer technician trying to illustrate it; 3) the customer trying to understand it.”
Rich Linsday, CLU, AEP, ChFC, InsMark Power Producer®, Top of the Table, International Forum, Pasadena, CA
“InsMark’s Checkmate® Selling strategy is still one of the most compelling tools to bring a client to a definitive decision, based on their best case alternatives!!! Solid mathematical comparisons that prove the validity of our insurance solution!!!”
Frank Dunaway, III, CLU, Legacy Advisory Services, Carthage, MO
Important Note #1: The hypothetical life insurance illustration associated with this Blog assumes the nonguaranteed values shown continue in all years. This is not likely, and actual results may be more or less favorable. Actual illustrations are not valid unless accompanied by a basic illustration from the issuing life insurance company.
Important Note #2: Many of you are rightly concerned about the potential tax bomb in life insurance that can accidentally be triggered by a careless policyowner. Click here to read Blog #51: Avoiding the Tax Bomb in Life Insurance.
Important Note #3: The information in this Blog is for educational purposes only. In all cases, the approval of a client’s legal and tax advisers must be secured regarding the implementation or modification of any planning technique as well as the applicability and consequences of new cases, rulings, or legislation upon existing or impending plans.
“InsMark” and “Wealthy and Wise” are registered trademarks of InsMark, Inc.

